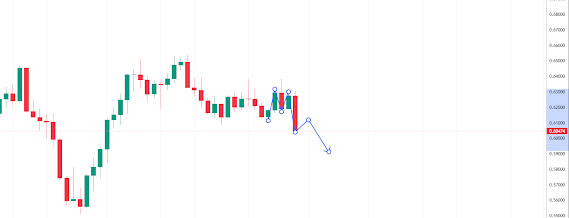
The NZD/USD Bears Eye a Continuation Below Structure Could Bulls Find Support at a Key Area?
The New Zealand dollar against the US dollar, known as NZD/USD, is currently facing bearish pressure as it eyes a potential continuation below key support levels. However, amidst this downward momentum, there might be a glimmer of hope for the bulls in the form of a possible correction. Let's delve into the technical outlook and explore the prospects for the week ahead.
Bearish Outlook on the NZD/USD Pair
Following the recent announcement by the Reserve Bank of New Zealand (RBNZ) confirming the easing of mortgage loan-to-value ratio (LVR) restrictions starting from June 1, the NZD/USD pair has been on the backfoot. This move by the central bank indicates a loosening of lending requirements, which can impact the overall demand for the New Zealand dollar.
On the weekly chart, we can observe the formation of an "M-pattern," with the last leg of this formation penetrating prior lows that could be considered as a crucial support structure. Such a breakdown in the market suggests a bearish sentiment and the potential for further downside movement in the NZD/USD pair.
A Glimpse of Potential Correction
While the technical outlook appears bearish at the moment, there is a possibility of a bullish correction in the near future. Market movements are never entirely linear, and corrections can offer opportunities for the bulls to regain some ground.
Exploring the Weekly Chart
Taking a closer look at the weekly chart, we can identify some key levels and indicators that may provide insights into the potential price action of NZD/USD.
Key Support Levels
The prior lows that have been penetrated by the M-formation serve as significant support levels. Traders and investors will closely monitor these levels to gauge the strength of the bearish pressure and to identify potential areas where bullish activity may emerge.
Moving averages
Moving averages can be valuable tools for understanding the overall trend and identifying potential areas of support or resistance. Traders often pay attention to the 50-week and 200-week moving averages, which can act as dynamic support or resistance levels. These moving averages can offer valuable insights into the sentiment and direction of the market.
Oscillators and momentum indicators
Oscillators and momentum indicators, such as the Relative Strength Index (RSI) or the Moving Average Convergence Divergence (MACD), can provide further confirmation of market trends and potential reversal points. Traders often rely on these indicators to determine oversold or overbought conditions, which can signal a potential shift in momentum.
A Week of Potential Reversal?
As we head into the upcoming trading week, it's essential to keep an eye on how the NZD/USD pair behaves around the key support levels mentioned earlier. If the bearish pressure continues to intensify, and the pair breaks below the support structure, it would further reinforce the bearish outlook and potentially open the door for more downside potential.
However, if the NZD/USD pair finds support at these key levels and begins to exhibit signs of a bullish reversal, it could indicate a possible correction in the making. Traders and investors should remain vigilant and closely monitor the price action, as this could present an opportunity for a potential bullish rally.
Conclusion
The NZD/USD pair is currently facing bearish pressure as it eyes a continuation below key support levels. The RBNZ's decision to ease mortgage LVR restrictions has contributed to this downward momentum. However, the market is never without surprises, and a potential bullish correction could be on the horizon. Traders and investors should closely observe the price action around the critical support levels, moving averages
